
Chinese industrial competition is intensifying across Europe, inside China and in third markets. US tariffs are reshaping those flows and may produce larger indirect effects over time. But the best current evidence does not show broad direct diversion from America into Europe. The deeper problem is harder: China is producing increasingly sophisticated manufactured goods at a scale its domestic economy struggles to absorb, while Europe enters the contest with expensive energy, weak investment and eroding industrial competitiveness.
23 August 2026 · ~14 minute read
CROSSWISE RESEARCH
48 source items materially examined · 11 core evidentiary chains · 18 primary/official records · 16 specialist economic and industrial sources · 14 independent reporting items · 17 key claims deliberately tested
Research cut-off: 23 August 2026
VIEW THE RECEIPTS ↓
WHY THIS STORY
A persuasive explanation is taking hold in Europe.
The United States has raised barriers against Chinese goods. Chinese manufacturers still need somewhere to sell. Europe remains comparatively accessible.
Therefore:
America is exporting its China shock to Europe.
There is a real mechanism behind that argument.
US tariffs have reduced Chinese exports to America. They can redirect particular products elsewhere, alter investment decisions and encourage Chinese companies to reorganise supply chains through third countries.
But that does not establish that America is the main cause of what Europe is experiencing.
The European Central Bank has tested the direct diversion thesis at product level. Its current evidence finds the broad effect on the euro area to be modest and statistically insignificant, while stronger diversion effects appear elsewhere.
At the same time, Europe's trade relationship with China is becoming increasingly unbalanced, and the composition of Chinese exports is changing.
China is no longer challenging Europe principally in low-cost manufacturing.
It increasingly competes in:
- machinery;
- vehicles;
- batteries;
- electrical equipment;
- chemicals;
- clean technology;
- and capital goods.
Germany—the European economy most exposed to this shift—is simultaneously losing ground inside China, facing more Chinese competition at home and encountering Chinese manufacturers in third markets.
Crosswise chose this story because the central proposition can be tested:
Is Europe’s new China shock primarily an American trade-policy spillover—or the result of deeper changes inside China and Europe themselves?
We examined trade flows, product-level tariff diversion, Chinese domestic demand, saving, industrial capacity, subsidies, automation, European energy costs, German trade, EV tariffs and the distributional consequences of import competition.
01 — WHAT WE KNOW
Europe’s trade relationship with China is becoming more one-sided
In 2025, according to Eurostat:
EU goods exports to China: €199.6bn
EU goods imports from China: €559.4bn
EU goods deficit with China: €359.8bn
Compared with 2024:
EU exports to China fell 6.5%.
EU imports from China rose 6.4%.
The deficit itself is not unprecedented. The EU recorded a still larger bilateral goods deficit in 2022.
What is increasingly consequential is the composition of the relationship.
Among the largest Chinese export categories entering Europe in 2025 were:
Electrical machinery and electronics — €164.9bn
Machinery and mechanical equipment — €106.5bn
alongside vehicles, chemicals and other manufactured products.
This is not principally a story about toys, textiles or low-cost household goods.
China is increasingly competing in sectors Europe historically regarded as part of its industrial core.
A €359.8bn deficit does not mean Europe “lost” €359.8bn
Trade balances are easily misused.
European consumers and businesses receive goods in return for the money they spend.
A cheaper Chinese:
- battery;
- solar module;
- machine;
- vehicle;
- electronic component
can benefit European households and downstream companies.
Imports can:
- reduce prices;
- lower capital expenditure;
- accelerate electrification;
- lower renewable-energy costs;
- and improve the competitiveness of European businesses using those inputs.
So:
A bilateral trade deficit describes the structure of trade. It is not a national-loss ledger.
But that is not the end of the argument.
The original China Shock literature demonstrated why aggregate gains from trade can coexist with severe local damage.
Import-exposed communities experienced persistent employment and wage effects even while consumers elsewhere benefited from cheaper goods.
That distinction matters enormously.
Crosswise therefore separates three questions:
NATIONAL WELFARE
Does trade make Europe richer overall?
DISTRIBUTIONAL DAMAGE
Which workers, companies and regions bear the losses?
STRATEGIC CAPABILITY
Does losing an industry create a dependency that becomes difficult to reverse?
Those questions can produce different answers.
US tariffs matter
American trade policy is not irrelevant to the European story.
The ECB estimates that recent US tariff measures reduced Chinese exports to the United States by approximately:
9%.
That is a material effect.
The United States has also substantially restricted access for particular Chinese products.
That changes:
- export incentives;
- company strategy;
- supply chains;
- investment locations;
- and the attractiveness of alternative markets.
Some Chinese trade is therefore being redirected because of American policy.
The harder question is how much of that redirection reaches Europe.
The best current evidence finds little broad direct diversion into Europe
The ECB tested this using detailed product-level data.
Its current finding is important.
Broad direct diversion towards the euro area was:
modest and statistically insignificant.
Statistically significant positive diversion was more apparent towards:
- ASEAN;
- and Africa.
Independent trade analysis reaches a broadly similar conclusion: much of China's export expansion reflects a wider secular increase rather than a simple transfer of US-bound goods into Europe.
But this finding needs an important limitation.
It tells us about direct trade diversion detectable in current product-level data.
It does not perfectly capture:
- third-country assembly;
- transshipment;
- Chinese-owned overseas production;
- indirect value added;
- or effects that may emerge with a lag.
ASEAN is particularly relevant because it is both a major destination for Chinese exports and an increasingly important manufacturing platform.
So the current evidence supports:
No broad direct US-to-Europe diversion has been demonstrated.
It does not establish:
US tariffs can never create significant indirect or lagged pressure on Europe.
That remains unresolved.
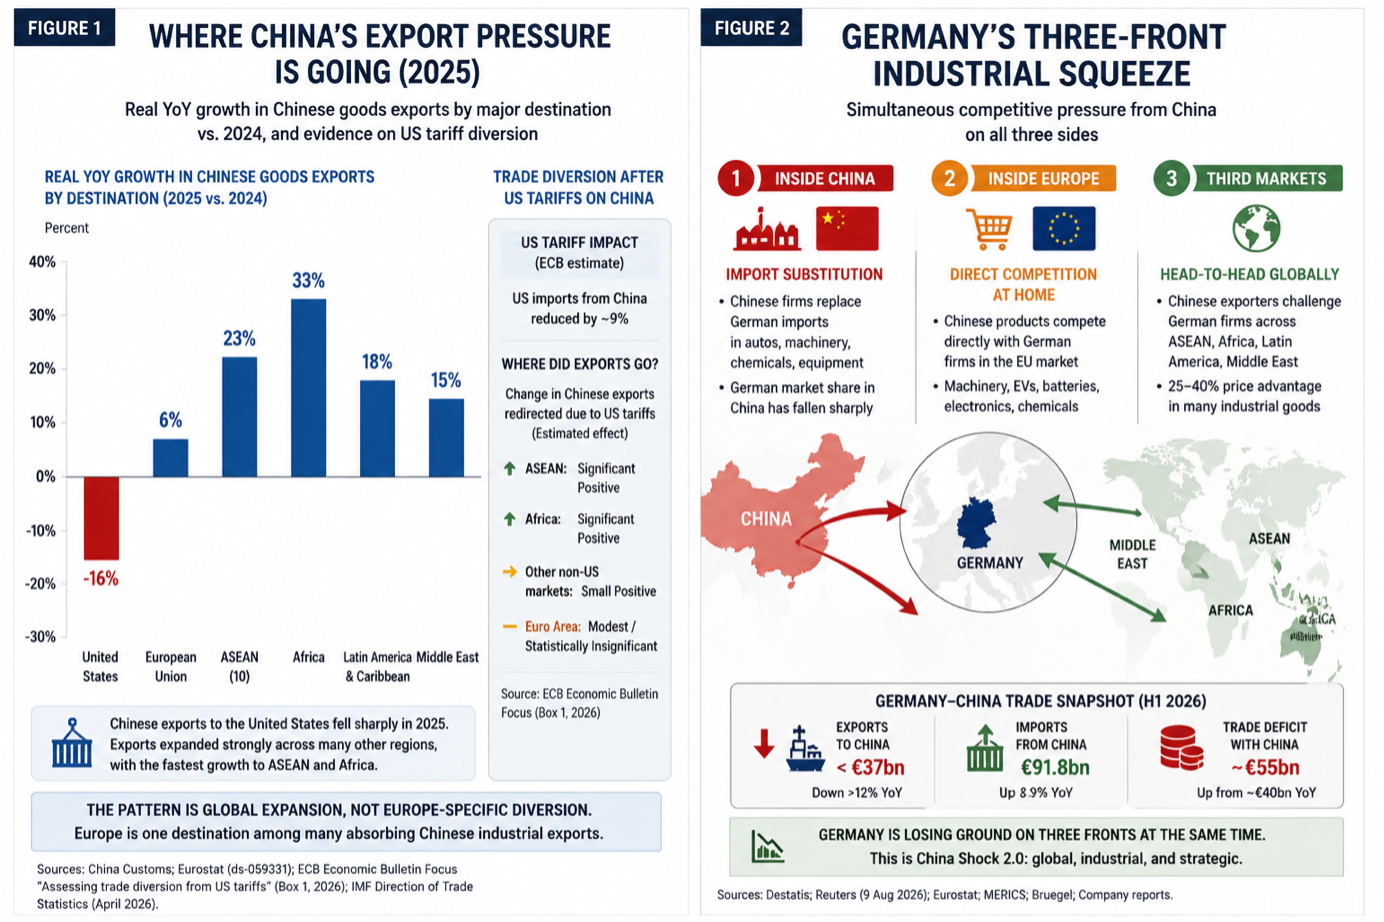
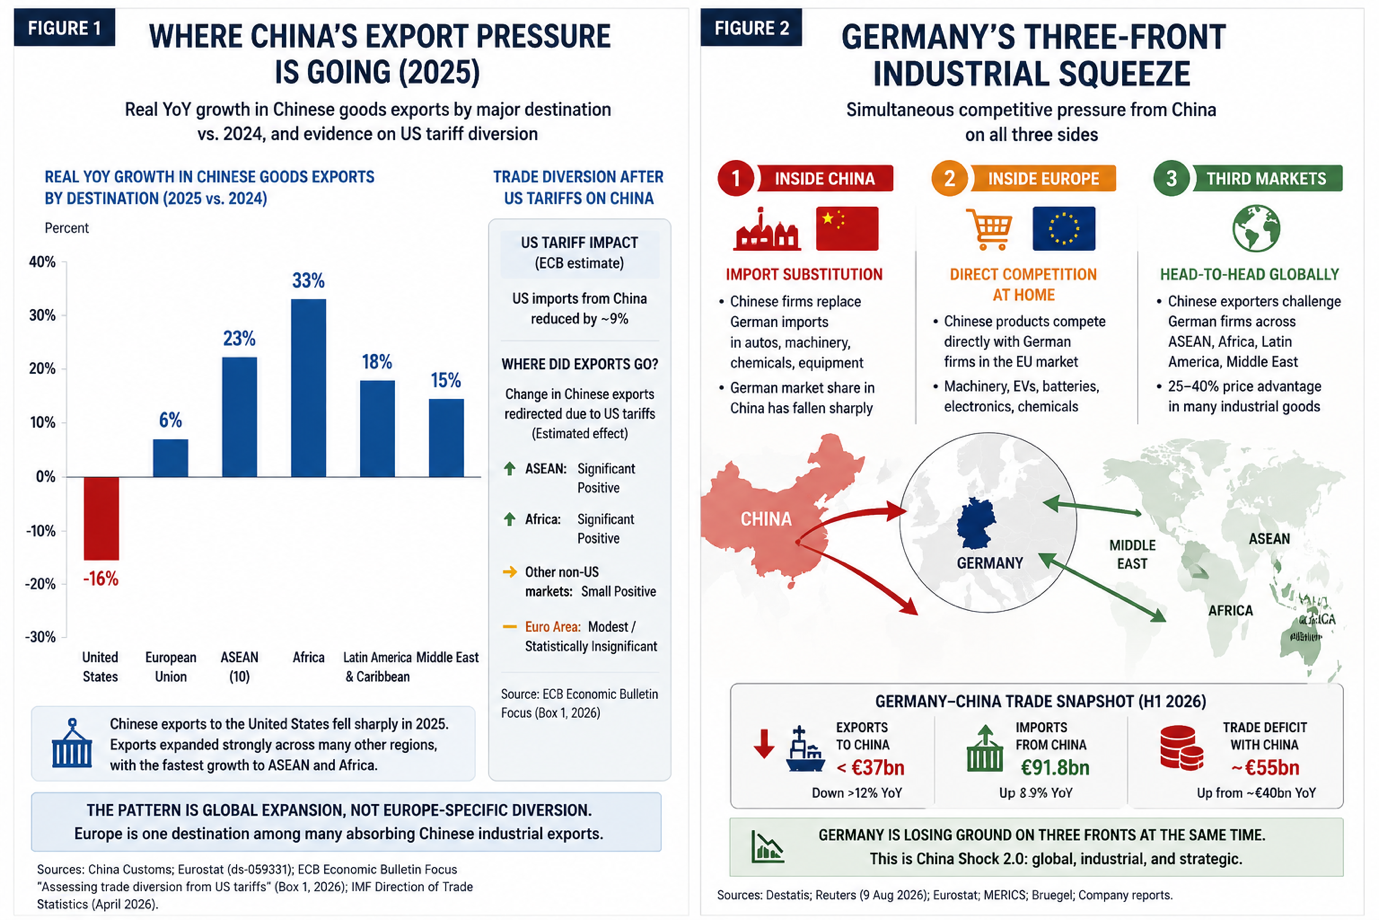
China’s export expansion is global
This distinction matters because a diversion story should leave a geographic signature.
If Europe were simply absorbing goods formerly destined for America, European imports should stand out unusually strongly.
Instead, Chinese exports have expanded across multiple regions.
In 2025:
- exports to the United States fell sharply;
- exports to the EU increased;
- exports to ASEAN increased faster;
- exports to Africa increased much faster;
- and Chinese exporters continued expanding across other emerging markets.
The pattern therefore looks less like:
US closes → Europe absorbs
and more like:
China expands globally while the United States becomes a less accessible destination.
US protectionism changes that pattern.
It does not appear to have created the underlying export push.
FIGURE 1 — WHERE CHINA’S EXPORT PRESSURE IS GOING
[
TAKEAWAY
US protectionism redirects some Chinese trade, but current product-level evidence does not show broad direct diversion into Europe. China’s export push is global.
The deeper mechanism begins inside China
China still saves an extraordinary proportion of national income.
The IMF estimates gross national saving at approximately:
42.1% of GDP in 2025.
Household consumption remains comparatively low at around 40% of GDP on recent comparable measures.
At the same time, China continues to experience:
- weak domestic demand;
- a prolonged property-sector adjustment;
- deflationary pressure;
- high industrial investment;
- and strong export performance.
The property sector is particularly important.
For years it absorbed enormous quantities of:
- capital;
- steel;
- machinery;
- glass;
- labour;
- and credit.
That engine has weakened.
Policy has simultaneously prioritised advanced manufacturing and what Beijing calls new productive forces.
The result is a structural imbalance.
China has built an enormous industrial system.
Its domestic economy does not absorb all of the output that system can produce.
That creates unusually strong incentives for Chinese companies to seek demand abroad.
The evidence supports that mechanism.
It does not justify the simplistic claim that every Chinese exporter is dumping unwanted production overseas.
China’s external surplus is extraordinary
China recorded an overall goods-trade surplus of approximately:
$1.2 trillion in 2025.
That is different from estimates of China's manufactured-goods surplus.
Specialist customs-based analysis puts the latter above $2 trillion, depending on classification and methodology.
Those measures should not be conflated.
But they point in the same direction:
China exports vastly more manufactured output than it imports.
That is now a structural feature of the global industrial economy.
“Overcapacity” is real — but the term is often abused
European and American policymakers increasingly describe China as suffering from industrial overcapacity.
There is strong evidence for that claim in selected industries.
There is weaker evidence for applying it indiscriminately to Chinese manufacturing as a whole.
China's aggregate manufacturing capacity utilisation was approximately:
74.6% in 2025.
That itself indicates meaningful slack relative to stronger utilisation environments.
It should not be dismissed.
But it also does not mean every Chinese manufacturing sector is structurally overbuilt.
The picture varies considerably.
Some clean-technology industries show much stronger evidence.
Battery manufacturing is one.
Specialist analysis indicates Chinese EV-battery manufacturing capacity substantially exceeds domestic demand and, on some measures, current global demand.
Solar provides another.
China controls more than 80% of manufacturing capacity across major stages of the global solar supply chain.
Crosswise therefore distinguishes:
BROADER INDUSTRIAL SLACK
Aggregate utilisation indicates meaningful unused capacity.
SUPPORTED.
SECTOR-SPECIFIC STRUCTURAL OVERCAPACITY
Strong evidence exists in selected sectors.
SUPPORTED.
UNIVERSAL CHINESE INDUSTRIAL OVERCAPACITY
Every Chinese manufacturing industry is irrationally producing beyond sustainable demand.
OVERSTATED.
That distinction matters because “overcapacity” can otherwise become a political label applied to any Chinese industry that is successfully exporting.
China is no longer a cheap-labour manufacturing story
Another simplification is equally misleading.
Chinese manufacturing success cannot be explained simply by low wages.
China has become one of the world's most automated manufacturing economies.
Its factories increasingly combine:
- industrial robotics;
- enormous scale;
- dense supplier networks;
- vertical integration;
- engineering capability;
- rapid learning;
- and intense domestic competition.
Robot density is not the same thing as productivity.
A factory can install large amounts of capital inefficiently.
But the scale of Chinese automation demonstrates something important:
Modern Chinese manufacturing is highly capital-intensive and technologically sophisticated.
The old image of China competing primarily through cheap labour is obsolete.
State support matters too
Recognising genuine Chinese industrial capability does not require pretending the playing field is entirely market-driven.
Chinese manufacturers operate inside an industrial system shaped by:
- state-directed credit;
- favourable financing;
- local-government support;
- industrial funds;
- land policy;
- energy policy;
- procurement;
- and regulatory intervention.
In sectors including:
- EVs;
- batteries;
- solar;
- semiconductors;
- and other strategic technologies,
specialist research indicates state support has been substantial.
That affects competitive conditions.
But Crosswise cannot responsibly assign a universal percentage of Chinese competitiveness to subsidies.
The evidence does not permit:
35% subsidy, 65% productivity
or any similarly neat decomposition.
The correct conclusion is:
Chinese industrial strength combines genuine capability with substantial state support, and the relative importance of each varies by sector.
Europe enters the contest with serious problems of its own
China is only one side of this story.
European industry has domestic weaknesses that existed before the latest Chinese export surge.
Energy is one.
Comparable European Commission data put EU industrial electricity prices around:
€165/MWh
against comparison levels of roughly:
€80/MWh
in the United States and China.
The precise gap varies substantially according to:
- member state;
- industry;
- contract;
- taxes;
- subsidies;
- and period.
But the structural disadvantage is real.
It is particularly damaging for:
- chemicals;
- metals;
- glass;
- fertilisers;
- paper;
- and other energy-intensive industries.
Europe also faces broader problems involving:
- investment;
- productivity;
- capital-market fragmentation;
- demographics;
- regulation;
- digital scale;
- infrastructure;
- and commercialisation of new technologies.
So the causal chain cannot simply be:
China became stronger, therefore Europe became weaker.
Parts of European industry were already weakening.
Chinese competition is hitting an industrial system that was under strain before the current surge.
Germany shows why the second shock is different
Germany is the clearest European stress case.
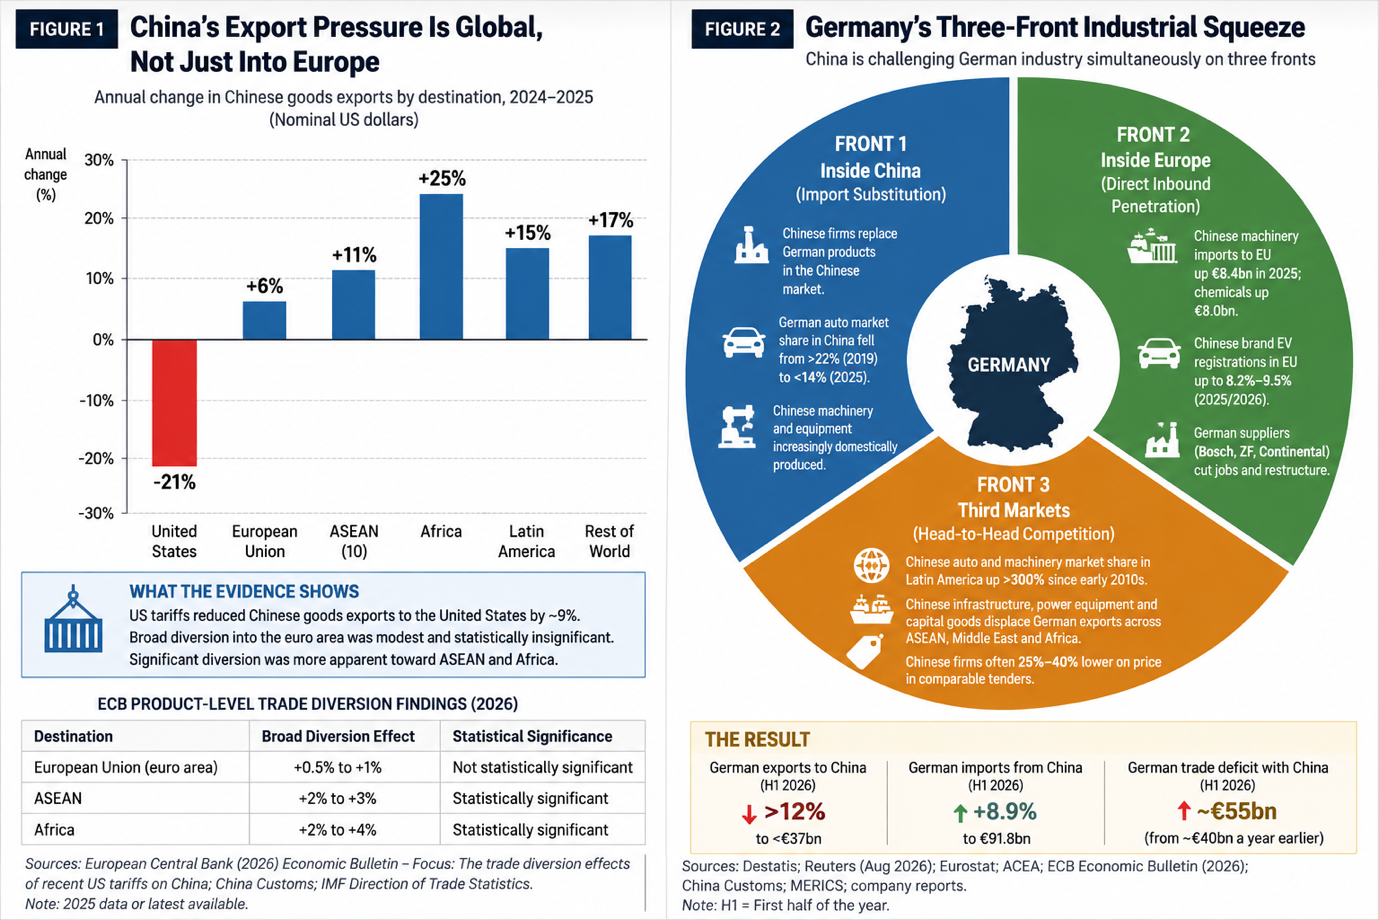
During the first half of 2026:
German exports to China: below €37bn
Change: down more than 12%
German imports from China: approximately €91.8bn
Change: up 8.9%
German goods deficit with China: approximately €55bn
That deficit had been around €40bn a year earlier.
But again, the trade balance is only the surface.
German industry increasingly confronts China on three fronts.
FRONT ONE — Inside China
Germany's old China model was enormously profitable.
As China industrialised, German companies supplied:
- vehicles;
- machinery;
- factory equipment;
- chemicals;
- and precision engineering.
China increasingly supplies itself.
Chinese companies are stronger in areas where German and other European firms once enjoyed large advantages.
That means European manufacturers face import substitution inside what had become one of their most important foreign markets.
FRONT TWO — Inside Europe
Chinese manufacturers increasingly compete directly in Europe's home market.
The competition now includes:
- EVs;
- electrical machinery;
- industrial equipment;
- batteries;
- clean technology;
- chemicals;
- and capital goods.
Europe is no longer principally importing products it stopped producing decades ago.
It increasingly imports sophisticated products competing directly with industries that remain central to European prosperity.
FRONT THREE — Third markets
China's export expansion across:
- ASEAN;
- Africa;
- Latin America;
- and the Middle East
creates another competitive front.
German and other European firms increasingly encounter Chinese competitors in markets neither side controls.
The evidence strongly establishes growing head-to-head competition.
It does not allow Crosswise to quantify consistently how much German market share has been directly displaced by Chinese firms across every third market.
That distinction matters.
But the strategic consequence remains:
Europe's industrial challenge is global, not merely a question of defending its domestic market.
FIGURE 2 — GERMANY’S THREE-FRONT INDUSTRIAL SQUEEZE
TAKEAWAY
German industry increasingly competes with China inside China, inside Europe and across third markets. The extent of direct displacement varies, but the competitive geography has fundamentally changed.
The EV tariffs show why trade defence is complicated
The EU imposed countervailing duties on battery-electric vehicles manufactured in China.
The definitive additional duties include approximately:
BYD — 17.0%
Geely — 18.8%
SAIC — 35.3%
on top of the standard 10% tariff.
Those duties remain part of the EU regime.
But the Commission can also accept exporter- or model-specific price undertakings where legal conditions are met.
Chinese companies have meanwhile adapted through strategies including:
- plug-in hybrids;
- localisation;
- European assembly;
- and alternative commercial arrangements.
That produces an important distinction.
“EU EV tariffs completely failed.”
Too strong.
“EU EV tariffs stopped Chinese automotive penetration.”
Also not supported.
The better conclusion is:
The duties altered the economics and composition of Chinese vehicle exports without eliminating the underlying competitive challenge.
02 — THE PERSPECTIVES
The serious disagreement is not whether Chinese competition exists.
It concerns why it exists, who actually loses, who gains and what Europe should do about it.
THE “AMERICA EXPORTED THE SHOCK” CASE
The argument is straightforward.
The United States has erected substantial barriers against selected Chinese goods.
Chinese firms have already built the factories.
The US market becomes harder to access.
Europe remains comparatively open.
Under this interpretation:
American protectionism transfers part of the adjustment burden onto Europe.
There is evidence for this mechanism.
US tariffs materially reduce Chinese exports to America.
Some diversion occurs.
The unresolved issue is indirect routing.
Goods can reach Europe after:
- third-country processing;
- assembly;
- transshipment;
- or relocation of Chinese-owned production.
Those channels are harder to observe in direct bilateral customs data.
And earlier trade conflicts show that diversion can emerge with a lag.
Strongest evidence
US restrictions demonstrably alter Chinese trade flows.
Strongest weakness
Current product-level evidence does not find broad direct diversion into the euro area.
CROSSWISE WEIGHT
LOW–MODERATE as the primary explanation.
MODERATE–HIGH as a contributing and sector-specific mechanism.
THE CHINESE DOMESTIC-IMBALANCE CASE
This interpretation begins inside China.
Domestic consumption remains weak relative to the size of the economy.
Saving remains extremely high.
The property boom that once absorbed enormous investment has faded.
Industrial policy continues to favour manufacturing and technological upgrading.
Chinese companies therefore possess both:
- large productive capacity;
- and strong incentives to seek foreign demand.
Under this interpretation, US tariffs influence where some output goes.
They do not explain why the external supply pressure exists in the first place.
CROSSWISE WEIGHT
HIGH.
THE “CHINA IS SIMPLY A FORMIDABLE INDUSTRIAL COMPETITOR” CASE
Another explanation is more uncomfortable for Europe.
Chinese manufacturers have become substantially more capable.
They possess advantages in areas including:
- scale;
- automation;
- supply-chain density;
- vertical integration;
- battery technology;
- engineering;
- and speed of industrial learning.
This does not mean state support is irrelevant.
It means:
industrial policy and genuine competitiveness can coexist.
The mistake would be to assume that removing subsidies tomorrow would automatically restore Europe's former industrial advantage.
CROSSWISE WEIGHT
MODERATE–HIGH.
THE “EUROPE DID THIS TO ITSELF” CASE
This interpretation argues that Chinese competition is exposing rather than creating Europe's industrial problems.
European industry faces:
- expensive energy;
- weak productivity growth;
- slow investment;
- fragmented capital markets;
- demographic pressure;
- regulatory complexity;
- and slower commercialisation.
Germany's industrial weakness did not begin with the latest Chinese export surge.
Strongest evidence
Several European industrial problems remain even in sectors with limited direct Chinese competition.
Weakness
Domestic weakness alone cannot explain the scale and composition of Chinese competitive gains.
CROSSWISE WEIGHT
MODERATE–HIGH.
Yes. It cut off at 02 — The Perspectives → “The Consumer-Gain Case.” I’ll continue from that exact point only so we do not duplicate the first half.
THE CONSUMER-GAIN CASE
Cheap Chinese imports can create substantial European benefits.
A cheaper:
- solar panel;
- battery;
- electric vehicle;
- machine;
- electronic component
can lower costs for households and businesses.
For Europe’s energy transition in particular, Chinese manufacturing scale has helped reduce the cost of deploying technologies that European governments simultaneously want adopted rapidly.
Under this interpretation, aggressive protectionism creates its own economic damage.
Tariffs may protect a European producer while:
- raising consumer prices;
- increasing costs for downstream manufacturers;
- slowing electrification;
- increasing infrastructure costs;
- and reducing competitive pressure on European incumbents.
But the original China Shock literature provides an important warning against stopping the analysis there.
Diffuse gains to millions of consumers can coexist with severe and persistent losses concentrated among particular:
- workers;
- factories;
- towns;
- regions;
- and industrial ecosystems.
Those losses can persist much longer than conventional trade models once assumed.
The relevant question is therefore not simply whether cheap Chinese imports produce benefits.
They do.
It is:
Whether those aggregate benefits compensate for concentrated economic damage and the possible loss of strategically important capabilities.
CROSSWISE WEIGHT
HIGH that consumer and downstream benefits exist.
UNRESOLVED on the long-term net welfare and strategic balance.
THE STRATEGIC-CAPABILITY CASE
A final interpretation argues that conventional welfare analysis misses something increasingly important.
Industrial capacity has option value.
A domestic industry can support:
- engineering knowledge;
- specialist suppliers;
- skilled labour;
- research;
- manufacturing know-how;
- defence production;
- technological spillovers;
- and the ability to expand production during crises.
Losing an industry can therefore matter even if importing its products is cheaper.
But this argument can also be abused.
If every declining European industry is declared “strategic,” strategic autonomy becomes a justification for indiscriminate protectionism.
Crosswise therefore applies four tests.
1. CONCENTRATION
Could Europe become dependent on a very small number of external suppliers?
2. SUBSTITUTABILITY
If supply disappeared, how rapidly could Europe replace it?
3. SPILLOVERS
Does the sector sustain wider technological or industrial capabilities?
4. CRISIS RELEVANCE
Would losing access materially affect:
- defence;
- energy;
- infrastructure;
- communications;
- transport;
- or economic continuity?
Those criteria can produce surprising results.
Solar-module assembly may attract enormous political attention because import concentration is extreme.
Machine tools may attract much less public attention while generating considerably greater spillovers across advanced manufacturing and defence.
The relevant policy question is therefore not:
Which European industries are losing?
It is:
Which losses would be genuinely difficult or dangerous to reverse?
03 — EVIDENCE CHECK
CLAIM: “US tariffs are exporting the China shock to Europe.”
CROSSWISE: OVERSTATED
US tariffs clearly affect Chinese trade.
They have reduced Chinese exports to the United States and create diversion incentives.
Some product-level diversion is observable.
But the strongest current evidence does not find broad, statistically significant direct diversion into the euro area.
The important qualification is that indirect routing through third countries and lagged effects remain difficult to measure.
The evidence therefore supports:
US tariffs are contributing to the redistribution of Chinese trade.
It does not currently support:
US tariffs are the principal cause of Europe’s China shock.
CLAIM: “There is no US-to-Europe diversion.”
CROSSWISE: ALSO TOO STRONG
Current evidence finds little broad direct diversion.
That is not the same as proving there is none.
Chinese production can reach Europe through:
- ASEAN manufacturing;
- third-country assembly;
- transshipment;
- Chinese-owned foreign factories;
- and other supply-chain changes.
Those channels cannot be captured perfectly through direct China–EU customs flows.
The first US–China trade conflict also demonstrated that diversion effects can develop with a lag.
VERDICT
Broad direct diversion: NOT CURRENTLY SUPPORTED.
Indirect or lagged diversion: UNRESOLVED.
CLAIM: “Europe is experiencing China Shock 2.0.”
CROSSWISE: SUPPORTED — AS AN ANALYTICAL DESCRIPTION
The phrase is a framework rather than an official economic category.
But the underlying shift is measurable.
Chinese competition increasingly affects:
- vehicles;
- machinery;
- electrical equipment;
- batteries;
- clean technology;
- chemicals;
- and capital goods.
European firms also face Chinese competition:
- inside China;
- inside Europe;
- and increasingly in third markets.
That is materially different from the composition and geography associated with the original China shock.
CLAIM: “China Shock 2.0 is basically the original China shock again.”
CROSSWISE: MISLEADING
The two episodes share a common mechanism:
increasing Chinese manufacturing competition alters production and trade elsewhere.
But their composition differs.
The original shock following China’s WTO accession was strongly associated with:
- labour-intensive manufacturing;
- import competition;
- employment displacement;
- and geographically concentrated labour-market effects.
The current challenge reaches much further into:
- capital goods;
- advanced manufacturing;
- clean technology;
- electrification;
- machinery;
- and sectors with substantial technological spillovers.
The strategic implications are therefore different.
CLAIM: “China has economy-wide industrial overcapacity.”
CROSSWISE: OVERSTATED
China’s aggregate manufacturing utilisation of around 75% indicates meaningful slack.
Some industries show substantially more serious excess capacity.
But manufacturing conditions differ enormously by sector.
It is therefore legitimate to identify:
broader industrial slack
and:
severe sector-specific overcapacity.
It is not legitimate to assume every successful Chinese export industry represents irrational excess production.
CLAIM: “Chinese subsidies explain why its manufacturers win.”
CROSSWISE: PARTLY SUPPORTED — MISLEADING IF USED ALONE
Chinese industrial policy materially affects competitive conditions.
Support is particularly important in several sectors central to the current dispute.
But Chinese manufacturers also possess genuine advantages in:
- scale;
- automation;
- supplier density;
- vertical integration;
- engineering;
- and accumulated manufacturing expertise.
The evidence does not permit a clean decomposition between those effects.
CLAIM: “Europe’s trade deficit proves China is dumping.”
CROSSWISE: FALSE / NOT ESTABLISHED
A bilateral trade deficit proves that Europe imports more goods from China than it exports there.
It does not establish:
- below-cost pricing;
- predatory behaviour;
- subsidy;
- dumping;
- or European welfare loss.
Those require separate evidence.
CLAIM: “Germany is losing to China everywhere.”
CROSSWISE: OVERSTATED
The evidence strongly supports a three-front increase in competitive pressure.
Germany is losing important market position inside China.
Chinese products increasingly compete against German producers inside Europe.
And Chinese firms increasingly encounter German exporters in third markets.
But Crosswise cannot consistently quantify direct Chinese displacement of German market share across every third-country market.
The strongest supported formulation is:
German industry increasingly faces Chinese competition on three fronts simultaneously.
CLAIM: “China is the main reason Europe is deindustrialising.”
CROSSWISE: OVERSTATED
Chinese competition materially increases the pressure.
But Europe also suffers from:
- high energy costs;
- weak investment;
- productivity problems;
- demographics;
- regulatory burdens;
- and fragmented capital markets.
Several of those problems predate the latest Chinese export surge.
China amplifies European industrial weakness.
It did not create all of it.
CLAIM: “EU tariffs stopped Chinese automotive penetration.”
CROSSWISE: NOT SUPPORTED
The duties changed the economics of Chinese-made BEVs.
But Chinese firms have responded through:
- product substitution;
- plug-in hybrids;
- localisation;
- European production;
- and other commercial arrangements.
Chinese competition has therefore not disappeared.
CLAIM: “EU EV tariffs failed.”
CROSSWISE: ALSO NOT SUPPORTED
A tariff does not need to eliminate imports to have an effect.
It can alter:
- prices;
- volumes;
- margins;
- product mix;
- investment;
- and production location.
The evidence indicates that the duties changed Chinese behaviour.
Whether they ultimately strengthen European industrial competitiveness is a different question.
CLAIM: “Cheap Chinese imports are good for Europe.”
CROSSWISE: INCOMPLETE
They can be.
Consumers and downstream companies can benefit substantially.
But the distribution of those gains matters.
The original China Shock literature demonstrates that aggregate gains can coexist with persistent and severe losses in import-exposed communities.
And national welfare is not identical to strategic resilience.
The complete question is therefore:
Who gains, who loses, for how long—and what capabilities disappear in the process?
CLAIM: “Europe should copy American protectionism.”
CROSSWISE: NOT ESTABLISHED
Europe and the United States have different:
- industrial structures;
- trade exposure;
- energy systems;
- consumer interests;
- and geopolitical constraints.
Broad tariffs could protect European production.
They could also:
- raise consumer prices;
- increase downstream costs;
- slow decarbonisation;
- provoke retaliation;
- and shelter inefficient incumbents.
The evidence supports targeted strategic choices.
It does not establish a case for blanket protectionism.
04 — WHAT WE DON’T KNOW
1. How large indirect tariff diversion really is
This is the most important unresolved question in the central thesis.
Current ECB evidence tests direct product-level diversion.
But Chinese production can reach Europe indirectly through:
- ASEAN;
- Mexico;
- Turkey;
- other manufacturing centres;
- Chinese-owned overseas factories;
- component trade;
- and third-country assembly.
Customs statistics cannot cleanly distinguish all of these mechanisms.
We therefore cannot rule out a larger indirect US-tariff effect than current direct trade data show.
2. Whether the diversion effect will increase with time
Trade adjustment is not instantaneous.
Companies need time to:
- redirect customers;
- relocate production;
- establish subsidiaries;
- alter shipping routes;
- build factories;
- and restructure supply chains.
Evidence from earlier tariff episodes suggests some effects can emerge with a lag.
The present evidence is therefore strong enough to assess current conditions.
It is not strong enough to close the question permanently.
3. The precise welfare balance
Crosswise cannot determine whether:
consumer and downstream gains from cheaper Chinese imports
ultimately exceed:
concentrated labour-market losses and the cost of lost industrial capability.
That depends on:
- sector;
- region;
- employment;
- wages;
- innovation;
- consumer savings;
- downstream productivity;
- switching costs;
- and strategic importance.
There is no single defensible number.
4. How much Chinese competitiveness comes from state support
The existence of significant support is well established.
Its exact contribution to Chinese industrial performance is not.
The answer also differs by sector.
The subsidy structure supporting:
- solar;
- batteries;
- EVs;
- semiconductors
is not necessarily representative of every Chinese manufacturer.
Crosswise therefore does not publish a universal subsidy-versus-productivity decomposition.
5. How much European industrial weakness would exist without China
Some would clearly remain.
Energy and productivity problems existed before the current export surge.
But the counterfactual cannot be directly observed.
We cannot know exactly how European industry would have performed if China had not simultaneously become a much stronger industrial competitor.
6. Whether Chinese localisation in Europe solves the dependency problem
Chinese companies are increasingly investing inside Europe.
That can create:
- European factories;
- jobs;
- suppliers;
- tax revenues;
- training;
- and physical production capacity.
But a factory being located in Europe does not necessarily mean Europe controls:
- the intellectual property;
- software;
- upstream materials;
- strategic decisions;
- or technology.
“Made in Europe” and “European strategic autonomy” are therefore not automatically equivalent.
7. Whether protection creates competitiveness
Trade protection can buy time.
What companies do with that time determines whether it succeeds.
If protected European firms:
- invest;
- innovate;
- scale;
- improve productivity;
- and reduce costs,
temporary protection could preserve strategic capability while restoring competitiveness.
If they do not, tariffs may simply require consumers and downstream companies to finance inefficient incumbents indefinitely.
We do not yet know which outcome current European policy will produce.
8. Where commercial dependence becomes strategic dependence
High import concentration does not automatically equal geopolitical vulnerability.
Strategic dependence depends on:
- supplier concentration;
- substitutability;
- inventory;
- switching time;
- technology;
- industrial spillovers;
- and crisis relevance.
There is no universal threshold at which:
30%, 50% or 80% imports
automatically becomes strategically dangerous.
9. Whether Germany’s third-market losses are primarily Chinese displacement
Chinese firms are expanding rapidly across emerging markets.
German exporters increasingly compete against them.
But sector-by-sector market-share displacement remains uneven and insufficiently measured for Crosswise to claim that China is directly responsible for every German loss in those markets.
The competitive pressure is established.
Its exact displacement effect is not.
05 — CROSSWISE ASSESSMENT
Europe is facing a second China shock.
But US protectionism is not its main cause.
American tariffs clearly matter.
They reduce Chinese access to the US market.
They redirect some trade.
They influence investment.
And they may generate larger indirect or lagged effects than current bilateral customs data can detect.
That is why Crosswise does not conclude that America has nothing to do with Europe’s problem.
But the strongest current evidence does not show broad direct diversion of Chinese exports from the United States into the euro area.
The larger phenomenon originates deeper inside China.
China has built an industrial system of extraordinary scale.
Domestic demand remains comparatively weak.
National saving remains unusually high.
The property sector no longer absorbs capital as it once did.
Industrial policy continues pushing investment towards advanced manufacturing.
And Chinese companies have become increasingly formidable competitors.
That last point matters.
Europe is not confronting only artificially cheap goods sustained by state support.
Chinese industrial policy has helped build manufacturing ecosystems that now possess genuine advantages in:
- scale;
- automation;
- supplier density;
- vertical integration;
- engineering;
- and accumulated production expertise.
State support and genuine competitiveness are not mutually exclusive.
Europe is also entering this contest with weaknesses of its own.
Its industrial energy costs remain high.
Investment has disappointed.
Productivity growth is weak.
Capital markets remain fragmented.
Demographic pressures are increasing.
And Germany’s old model—selling sophisticated industrial goods into a rapidly industrialising China—is being undermined by China's own technological development.
That creates the three-front challenge.
European firms face China:
inside China, inside Europe and across third markets.
This is what makes the current episode different from the original China shock.
The first shock was heavily associated with low-cost import competition and labour-intensive manufacturing.
The second increasingly reaches:
- machinery;
- batteries;
- electrical equipment;
- vehicles;
- clean technology;
- industrial systems;
- and other sectors with potentially significant technological spillovers.
But Europe should be careful about what conclusion it draws from that.
Cheap Chinese imports can produce real benefits.
They can make:
- energy;
- transport;
- capital equipment;
- electrification;
- and infrastructure
cheaper.
A trade deficit does not prove impoverishment.
Yet the original China Shock literature also demonstrates why aggregate welfare is not enough.
Diffuse consumer gains can coexist with persistent damage concentrated in particular workers, towns and industrial regions.
And neither measure answers the strategic question.
Europe therefore needs to distinguish three things:
commercial pain;
distributional damage;
and
strategic vulnerability.
They are not synonymous.
A European factory closing does not automatically constitute a national-security problem.
Conversely, losing a relatively obscure industrial capability can create enormous future dependence if it supports:
- defence;
- critical infrastructure;
- technological spillovers;
- or production that cannot be recreated quickly.
That leads to a much harder policy question than whether Europe should “stop China.”
Europe needs to decide:
Which industrial capabilities can it afford to import, which does it genuinely need to retain, and how much is it prepared to pay to retain them?
CROSSWISE ASSESSMENT
Europe is facing a second China shock, but US protectionism is not its main cause.
American tariffs redirect some Chinese trade and may generate larger indirect effects over time. But current product-level evidence finds only limited broad direct diversion into Europe.
The larger pressure comes from China's domestic economic structure and from an industrial system that combines extensive state support with increasingly genuine global competitive strength.
Europe’s own weaknesses determine how damaging that pressure becomes.
The new shock is particularly consequential because Chinese firms increasingly compete in advanced industrial sectors Europe expected to underpin its future prosperity.
But cheap imports also create real benefits, while the original China Shock literature warns that those aggregate gains can coexist with severe and persistent local losses.
The European policy problem is therefore not simply how to block Chinese goods.
It is:
Which capabilities can Europe not afford to lose—and will protection actually rebuild competitiveness or merely preserve incumbents?
CROSSWISE CONFIDENCE
The current China–Europe industrial shift is materially different from China Shock 1.0: HIGH
The composition and geography of Chinese competition have changed substantially.
The “China Shock 2.0” label remains an analytical description rather than a measurable economic category.
US tariffs are the primary cause: LOW–MODERATE
Current evidence weighs strongly against this interpretation.
But indirect and lagged channels prevent a LOW or near-zero confidence assessment from being justified.
Broad direct US→Europe diversion currently exists: LOW
The strongest available product-level evidence does not find a statistically significant broad euro-area effect.
Indirect or lagged tariff diversion could become materially important: MODERATE / UNRESOLVED
The mechanisms exist.
Their magnitude cannot currently be measured cleanly.
Weak Chinese domestic demand and high saving materially drive external industrial pressure: HIGH
The macroeconomic evidence strongly supports the mechanism.
Chinese firms possess genuine industrial competitive advantages: MODERATE–HIGH
The evidence supports scale, automation, integration and industrial sophistication.
Direct productivity comparisons remain harder.
Chinese state support materially contributes in strategic sectors: HIGH
This is well established.
Its exact contribution relative to genuine productivity varies by industry and cannot be cleanly decomposed.
European structural weakness materially amplifies the shock: HIGH
Energy, productivity, investment and other problems independently predate the latest Chinese export surge.
Diffuse consumer gains can coexist with severe concentrated losses: HIGH
This is one of the central lessons of the original China Shock literature.
China is the primary cause of European deindustrialisation: LOW–MODERATE
The evidence supports a strongly multi-causal explanation.
Broad European protectionism is the correct response: UNRESOLVED
The answer depends on:
- industry;
- concentration;
- substitutability;
- spillovers;
- consumer costs;
- and whether protection leads to genuine productivity improvement.
WHAT WOULD CHANGE OUR ASSESSMENT?
Broad direct US→EU diversion becomes statistically significant
A later product-level study showing large, sustained diversion into Europe would materially strengthen the American-policy explanation.
Indirect rerouting through third countries proves much larger than current data suggest
If robust evidence shows that substantial quantities of US-excluded Chinese production are reaching Europe through:
- ASEAN assembly;
- transshipment;
- Chinese-owned overseas manufacturing;
- or other indirect channels,
the current assessment would need to assign much more weight to US trade policy.
Chinese export growth becomes disproportionately concentrated on Europe
If exports to:
- ASEAN;
- Africa;
- Latin America;
- and other non-US destinations
flatten while Europe continues absorbing rapidly rising Chinese volumes, the “Europe as residual market” thesis would become much stronger.
Chinese domestic consumption rises materially while export pressure falls
A sustained increase in:
- household consumption;
- domestic demand;
- and imports
combined with a shrinking external surplus would strengthen the argument that weak domestic absorption is one of the central mechanisms behind China’s export pressure.
European energy costs converge towards US and Chinese levels without improving industrial performance
That would weaken the claim that Europe’s own cost structure is an important part of the problem.
More explanatory weight would shift towards:
- Chinese industrial capability;
- state support;
- and broader productivity differences.
European productivity and investment improve materially but Chinese competitive gains continue at the same pace
Again, the evidence would shift away from the “Europe weakened itself” explanation and towards Chinese competitive strength.
Trade protection produces genuine European industrial recovery
If protected sectors subsequently:
- invest;
- innovate;
- achieve scale;
- reduce costs;
- expand exports;
- and become competitive without permanent protection,
the case for targeted European trade defence would strengthen materially.
Protection raises prices while protected firms fail to improve
That would strengthen the opposite interpretation:
trade barriers are transferring costs to European consumers and downstream businesses without rebuilding competitiveness.
CROSSWISE RADAR
INDONESIA · CHINA
Jakarta’s multi-alignment strategy is becoming harder to sustain.
Indonesia is deepening defence-industrial cooperation with China while maintaining substantial security relationships with Australia, the United States, Japan and other partners.
Why it matters: Indonesia’s challenge is increasingly not whether to choose a bloc, but whether it can distribute dependencies before any one becomes difficult to replace.
What to watch: the final ownership, technology-transfer and supply-chain structure of the proposed China-linked munitions facility.
ARCTIC SHIPPING
China’s seasonal Arctic route is entering the evidence phase.
Sea Legend’s China–Europe Arctic service has moved beyond one-off demonstration voyages into scheduled seasonal operation.
Why it matters: realised transit times are only one part of the commercial question.
What to watch: load factors, return-leg cargo, insurance costs, schedule reliability and whether subsequent seasons expand.
GLOBAL BONDS
High long-term yields remain a warning without becoming a funding crisis.
Developed sovereign borrowers continue paying historically elevated long-duration financing costs while markets and auctions remain broadly functional.
Why it matters: fiscal pressure can accumulate gradually for years before producing classical crisis signals.
What to watch: auction tails, dealer participation, term premiums and whether US long yields begin materially decoupling from other developed sovereign markets.
IRAN · SANCTIONS
Enforcement remains more important than designation.
Washington continues increasing pressure on Iranian economic and commercial networks.
Why it matters: sanctions become substantially more consequential only when banks, commodity traders, shipping networks and intermediary jurisdictions restrict actual transactions.
What to watch: enforcement behaviour in major third-country trade and financial hubs.
THE RECEIPTS
Research cut-off: 23 August 2026
RESEARCH LEDGER
48 source items materially examined
11 core independent evidentiary chains carrying the principal conclusions
18 primary / official records
16 specialist economic / industrial sources
14 independent and regional reporting items
17 key claims explicitly tested
10 material uncertainties retained after red-team adjudication
The source categories overlap and should not be added mechanically.
A source item means a record materially consulted or relied upon.
An evidentiary chain attempts to remove false corroboration when multiple publications ultimately rely on the same:
- official dataset;
- government release;
- academic study;
- company statement;
- or specialist calculation.
The core conclusions therefore rest on materially fewer independent chains than the raw source count.
HOW CROSSWISE COUNTS
Crosswise does not treat repetition as corroboration.
If Reuters, the Financial Times and multiple European newspapers repeat the same Eurostat release, that remains fundamentally:
one Eurostat evidentiary chain.
The same applies to:
- ECB trade-diversion estimates;
- IMF China macroeconomic data;
- Chinese customs figures;
- IFR automation statistics;
- European Commission tariff regulations;
- and specialist estimates of Chinese industrial subsidies.
Crosswise also distinguishes between claims that are often collapsed together.
TRADE DEFICIT
describes the structure of bilateral trade.
It does not by itself prove national economic loss.
TRADE DIVERSION
requires evidence that trade flows changed because access to another market changed.
Correlation is insufficient.
OVERCAPACITY
should be demonstrated by:
- capacity;
- utilisation;
- persistent weak pricing;
- inventories;
- profitability;
- or other sector evidence.
High exports alone do not establish it.
SUBSIDY
does not automatically mean an industry lacks genuine productivity.
COMPETITIVENESS
does not prove the competitive environment is market-neutral.
COMMERCIAL LOSS
is not automatically strategic vulnerability.
STRATEGIC DEPENDENCE
requires evidence concerning:
- concentration;
- substitutability;
- switching time;
- technological spillovers;
- and crisis relevance.
PRIMARY & OFFICIAL RECORDS
1. Eurostat — EU–China Trade in Goods, 2025
Used for:
- €559.4bn EU goods imports from China;
- €199.6bn EU goods exports to China;
- €359.8bn bilateral deficit;
- 2025 import and export growth rates;
- import composition.
Key categories used:
- electrical machinery and electronics: €164.9bn
- machinery and mechanical equipment: €106.5bn
Limitation: nominal trade values do not measure welfare, productivity or value added.
2. Eurostat — Historical EU–China Trade Series
Used to establish that the 2025 bilateral deficit was not an all-time record.
The 2022 deficit was larger.
Role: prevents overstating the significance of the headline deficit and shifts emphasis towards composition.
3. European Central Bank — Economic Bulletin 1/2026, Chinese Export Diversion Analysis
Used for the central test of whether US tariffs redirected Chinese goods into the euro area.
Key findings used:
- recent US tariffs reduced Chinese exports to the United States by approximately 9% in the model estimate;
- broad direct diversion into the euro area was modest and statistically insignificant;
- significant positive diversion effects were detected more clearly towards ASEAN and Africa.
Limitation:
The study primarily tests direct, contemporaneous product-level diversion.
It cannot fully measure:
- transshipment;
- indirect value added;
- third-country assembly;
- Chinese-owned overseas manufacturing;
- or effects emerging with a longer lag.
This limitation is retained in the final Assessment.
4. International Monetary Fund — China 2025 Article IV Consultation
Used for:
- gross national saving of approximately 42.1% of GDP;
- weak domestic demand;
- property-sector adjustment;
- deflationary pressures;
- external imbalance;
- contribution of net exports to growth.
Role: primary macroeconomic support for the domestic-imbalance mechanism.
5. World Bank — Household Final Consumption Expenditure
Used to contextualise Chinese household consumption at approximately 40% of GDP on recent comparable measures.
Limitation: definitions and latest-year availability differ from IMF and Chinese national-account measures.
6. General Administration of Customs of China
Used for:
- China’s overall 2025 goods-trade surplus;
- export growth by major destination;
- geographic breadth of Chinese export expansion.
Role: primary Chinese customs evidence.
7. National Bureau of Statistics of China
Used for:
- manufacturing capacity utilisation;
- sector-level utilisation data;
- industrial production context.
Key figure:
Aggregate manufacturing utilisation approximately 74.6% in 2025.
Interpretation: evidence of meaningful broader slack, but not proof that every Chinese industrial sector is structurally overbuilt.
8. European Commission — Industrial Energy Price Comparisons
Used for comparative industrial electricity costs.
Approximate comparison used:
EU: €165/MWh
versus roughly:
US / China comparison levels: ~€80/MWh
Limitation: prices vary considerably by:
- country;
- industry;
- tax regime;
- subsidy;
- contract structure;
- and period.
The figures establish broad cost disadvantage rather than a universal company-level price ratio.
9. International Federation of Robotics — World Robotics
Used to establish that China has become one of the world’s most highly automated manufacturing economies.
Crosswise use after red-team correction:
The edition does not depend on an unverified exact Chinese robot-density number.
Robot density is used only to establish the broader point that Chinese manufacturing is increasingly capital-intensive and automated.
Limitation: automation density is not itself a direct measure of total factor productivity.
10. European Commission — Chinese Battery-Electric Vehicle Countervailing Duties
Used for the definitive tariff framework.
Additional duties include approximately:
BYD — 17.0%
Geely — 18.8%
SAIC — 35.3%
in addition to the standard EU import tariff.
11. Official Journal of the European Union — Regulation 2024/2754 and subsequent implementation
Used for:
- legal basis of the duties;
- manufacturer-specific rates;
- implementation framework.
Current-status qualification:
The duties remain operative, while the Commission can accept exporter- or model-specific price undertakings where conditions are satisfied.
12. Destatis — Germany Foreign Trade Data
Used to establish Germany’s changing trade relationship with China.
Used together with independent reporting for H1 2026 figures.
13. United States Section 301 Trade Measures
Used to establish the scale and timing of US barriers affecting selected Chinese industrial exports.
Role: establishes the policy shock necessary for testing trade diversion.
14. US Trade and Customs Records
Used to establish declining imports of targeted Chinese goods and the broader change in bilateral trade.
15. International Energy Agency — Solar PV Global Supply Chains
Used for China’s dominance of manufacturing capacity across major solar-production stages.
Key finding used:
China accounts for more than 80% of capacity across major stages of the global solar supply chain.
16. European Commission — Foreign Subsidies Regulation
Used to establish the EU’s expanding toolkit for addressing subsidised foreign participation inside the Single Market.
17. Net-Zero Industry Act
Used for EU ambitions to increase domestic clean-technology manufacturing capacity.
18. Critical Raw Materials Act
Used for Europe’s wider strategic-dependency and resilience framework.
SPECIALIST ECONOMIC / INDUSTRIAL SOURCES
19. Rhodium Group — Clean Investment / Battery Manufacturing
Used for evidence that Chinese battery production capacity materially exceeds domestic absorption and, on some measures, current global demand.
Limitation: installed capacity is not the same thing as active or profitable output.
20. Centre for European Reform — China Shock 2.0 / German Industry
Used for conceptual analysis of:
- German exposure;
- China’s movement up the value chain;
- competition in advanced industrial sectors.
Dependency note: load-bearing numerical claims were checked against independent or primary sources.
21. Council on Foreign Relations / Brad Setser
Used for specialist customs-based estimates of China’s manufactured-goods surplus.
Important distinction:
The estimate above $2tn refers to a specialist construction of the manufacturing surplus.
It is not the same measure as the approximately $1.2tn overall official goods-trade surplus.
22. Kiel Institute for the World Economy
Used for research into Chinese industrial subsidies and state support.
Limitation: the scale of subsidies depends heavily on whether estimates include:
- cheap credit;
- land;
- tax benefits;
- equity;
- local support;
- or other indirect instruments.
Crosswise does not treat any one subsidy estimate as a complete measure.
23. OECD Industrial Subsidy Research
Used as an independent methodological chain for examining state support and market distortions.
24. Bruegel
Used for:
- EU–China trade policy;
- European competitiveness;
- industrial policy;
- strategic-dependency analysis.
25. MERICS
Used for:
- Chinese industrial policy;
- manufacturing upgrading;
- domestic competition;
- China–Europe industrial relations.
26. IEA Clean-Energy Manufacturing Analysis
Used for:
- batteries;
- solar;
- clean-technology supply chains;
- global production concentration.
27. European Automotive Market Data
Used to assess:
- Chinese-brand penetration;
- Chinese-made vehicles;
- EV/PHEV adaptation;
- changes following EU trade measures.
28. Battery Industry Analysis
Used for:
- Chinese capacity;
- utilisation;
- supply-chain concentration;
- European battery investment.
29. German Industrial Research
Used to test the three-front competitive framework:
- inside China;
- inside Europe;
- third markets.
Red-team qualification:
The final edition claims increasing competition in third markets rather than universally proven German displacement.
30. Machinery / Capital-Goods Research
Used to examine Chinese expansion into sectors historically central to European comparative advantage.
31. European Chemical Industry Research
Used for the interaction between:
- Chinese capacity;
- European energy costs;
- plant economics;
- industrial restructuring.
32. Solar Industry Research
Used for the trade-off between:
- inexpensive Chinese supply;
- European manufacturing decline;
- accelerated decarbonisation;
- strategic concentration.
33. European Industrial-Policy Research
Used to distinguish:
- trade defence;
- industrial policy;
- competitiveness;
- and strategic resilience.
34. Trade-Welfare and China Shock Literature
Used to distinguish:
- aggregate consumer gains;
- producer losses;
- regional labour-market effects;
- and persistent distributional damage.
This includes the core analytical lesson associated with the original Autor–Dorn–Hanson China Shock literature:
aggregate gains from trade can coexist with severe and durable local labour-market losses.
That distinction was added following hostile red-team review.
INDEPENDENT & REGIONAL REPORTING
35. Reuters — German Trade Deficit with China, August 2026
Used for H1 2026 German trade figures:
- exports to China below approximately €37bn;
- decline of more than 12%;
- imports from China approximately €91.8bn;
- increase of 8.9%;
- bilateral deficit around €55bn.
Underlying chain: Destatis and associated trade reporting.
36. Reuters — European Industrial Recovery / Manufacturing
Used to establish that European industrial weakness predates and extends beyond the latest Chinese import surge.
37. Reuters — Chinese PHEV Adaptation
Used for evidence that Chinese automakers altered product strategy after European BEV countervailing duties.
38. Reuters — 2026 EU–China EV Trade Developments
Used for the evolution of the tariff regime, price undertakings and manufacturer adaptation.
39. Financial Times — European Industrial Competition
Used for European corporate and policy responses to Chinese industrial pressure.
40. Bloomberg — Chinese Export / European Manufacturing Reporting
Used for market and corporate context independent of Eurostat-derived reporting.
41. Handelsblatt — German Industry
Used for company-level and industrial context in the German market.
42. Politico Europe — EU Trade and Industrial Policy
Used for the political debate around:
- trade defence;
- subsidies;
- local production;
- European strategic autonomy.
43. Nikkei Asia — Chinese Manufacturing and Third-Market Expansion
Used to contextualise China’s competitive expansion beyond Europe and the United States.
44. European Automotive Reporting
Used to assess:
- market penetration;
- vehicle mix;
- localisation;
- European OEM response.
45. European Chemical-Sector Reporting
Used for:
- closures;
- investment shifts;
- energy pressure;
- Chinese competition.
46. Renewable-Energy Trade Reporting
Used for solar and battery trade dynamics.
47. Global South Business Reporting
Used to assess Chinese export expansion across:
- ASEAN;
- Africa;
- Latin America;
- Middle East.
48. Independent Machinery / Capital-Goods Reporting
Used to examine direct competition between Chinese and European producers in advanced industrial goods.
THE KEY CLAIMS CROSSWISE TRIANGULATED
1. Europe is facing a materially different phase of Chinese industrial competition.
Finding: supported.
2. US tariffs are the primary cause.
Finding: not supported by current evidence.
3. US tariffs redirect some Chinese exports.
Finding: supported.
4. Broad direct diversion into Europe is already occurring.
Finding: not currently supported.
5. Indirect and lagged diversion may be larger than bilateral data show.
Finding: plausible / unresolved.
6. Weak Chinese domestic demand contributes materially to external industrial pressure.
Finding: strongly supported.
7. China has universal industrial overcapacity.
Finding: overstated.
8. China has meaningful broader industrial slack and severe sector-specific overcapacity.
Finding: supported.
9. Chinese industrial success is solely subsidy-driven.
Finding: not supported.
10. Chinese state support materially affects competition in strategic sectors.
Finding: supported.
11. Chinese manufacturing has genuine scale and capability advantages.
Finding: supported with qualification.
12. Europe’s own structural weaknesses materially amplify Chinese pressure.
Finding: strongly supported.
13. Germany faces Chinese competition on three fronts.
Finding: supported.
Direct third-market displacement is not uniformly quantified.
14. EU EV duties ended Chinese automotive competition.
Finding: not supported.
15. EU EV duties had no effect.
Finding: also not supported.
16. A bilateral trade deficit proves national economic loss.
Finding: false / misleading.
17. Cheap Chinese imports can generate aggregate benefits while producing persistent concentrated losses.
Finding: strongly supported.
WHAT WE COULD NOT OBTAIN
Crosswise could not obtain:
a definitive measure of indirect Chinese exports reaching Europe through ASEAN and other third-country production systems;
a comprehensive estimate of tariff-driven transshipment into Europe;
a clean measure separating genuine third-country manufacturing from tariff circumvention;
a universal quantitative decomposition of Chinese industrial advantage into:
- subsidy;
- scale;
- productivity;
- automation;
- finance;
- and supply-chain effects;
a definitive current economy-wide measure of Chinese manufacturing overcapacity;
complete profitability data for Chinese exporters selling into Europe;
a reliable counterfactual showing how European industry would have performed without increased Chinese competition;
a single welfare estimate balancing:
- consumer gains;
- downstream productivity benefits;
- regional employment losses;
- and long-term capability loss;
a precise measure of how much German third-market share has been directly displaced by Chinese competition across all sectors;
a universal threshold at which import concentration becomes strategic dependence;
a reliable forecast of whether Chinese-owned factories inside Europe increase or reduce European strategic autonomy;
or
evidence showing whether European industries protected today will become globally competitive rather than dependent on permanent support.
Those unresolved questions are reflected explicitly in the confidence assessments.
RADAR SOURCES
INDONESIA · CHINA
Sources include:
- Indonesian Ministry of Defence;
- Chinese defence and foreign ministries;
- Australian government;
- Japanese Ministry of Defense;
- US defence documentation;
- BPS;
- SIPRI.
ARCTIC SHIPPING
Sources include:
- Sea Legend;
- Northern Sea Route Administration;
- Rosatom;
- Centre for High North Logistics;
- Suez Canal Authority;
- specialist maritime reporting.
GLOBAL BONDS
Sources include:
- US Treasury;
- Federal Reserve;
- auction results;
- sovereign-market data;
- independent financial reporting.
IRAN · SANCTIONS
Sources include:
- US Treasury;
- other relevant government releases;
- independent international reporting;
- sanctions and commercial-network analysis.
FOUND SOMETHING WE MISSED?
Crosswise welcomes evidence that challenges its conclusions.
If you possess:
- a primary document;
- dataset;
- contract;
- statistical release;
- or other material evidence
that could materially change this assessment:
Material factual errors will be corrected transparently rather than silently amended.
CROSSWISE
The facts. The perspectives. The evidence. The unknowns. Our assessment.
One consequential story each weekday. Read crosswise.